Analyze Excel and CSV data
Inspect the data, specify calculations, and validate tables, charts, and interpretation.
Updated: September 2026
Start calculations with GPT-5.6 Terra and an attached Excel or CSV file. Gemini 3.8 Flash can also help interpret findings. Check whether a result was actually calculated from the file rather than described as an example.
Prepare the data
Use one header row and consistent date and number formats. State units and periods, identify the worksheet, and avoid counting a total row again as source data.
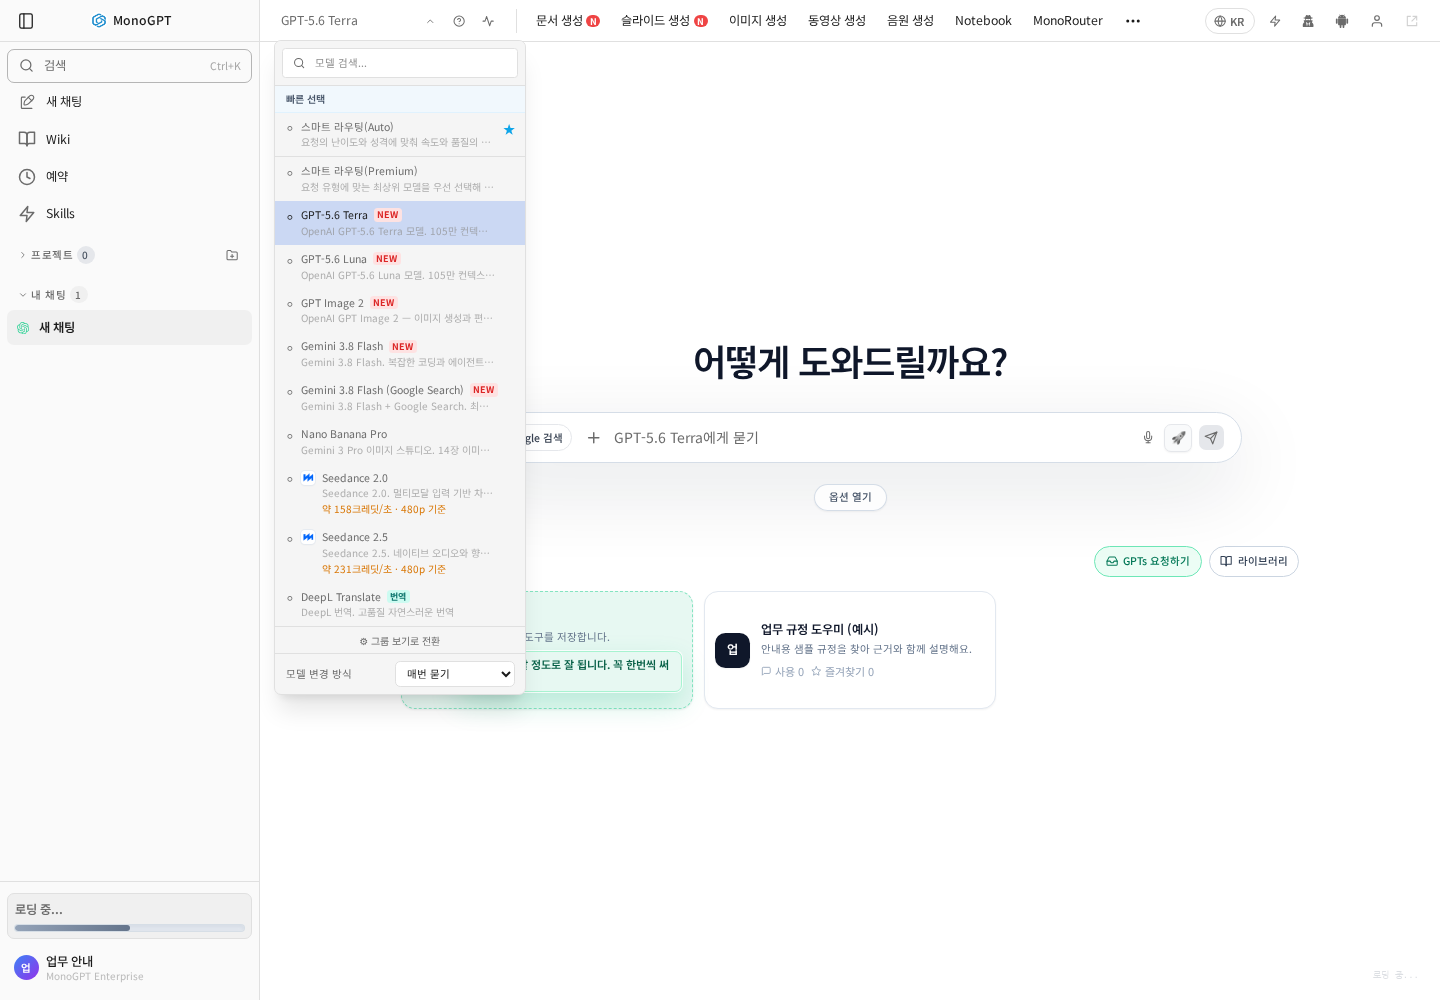
Choose an available analysis model, then attach the file in chat.
Inspect first
Read the Monthly Results sheet in production.xlsx. List columns, date range, row count, missing values, and duplicates. Explain which calculations are possible without filling missing values yourself.
Define the calculation
Sum produced units and defective units by month. Calculate defect rate as total defects divided by total production times 100. Mark months with zero production as excluded. Produce a summary table and trend chart, explain month-to-month changes, and provide an Excel result file if supported.
- Correct any misinterpreted column names.
- Specify the period, filters, formula, and units.
- Confirm that the requested table, chart, or file exists.
- Recalculate totals and a few representative rows in the original spreadsheet.
Interpret carefully
Separate observed changes from possible causes. List additional data needed to test each explanation without presenting correlation as a confirmed cause.
If it does not work
If execution or file generation is unavailable, use an enabled model or feature that supports the task. Try a smaller worksheet or CSV for complex files. Check percentage denominators and duplicate totals. Sheets may currently show an internal-validation access restriction; start ordinary analysis with file attachments in chat.
Was this answer helpful?